The file format for vehicle output is as follows:
0.99snap
The most important fields for our purposes here are time and the two spatial coordinates. When these fields are filled out correctly, the Transims visualizer will work even when all other fields are filled with dummy variables.
Some linear algebra is necessary to calculate the position and the orientation of the vehicles. It goes as follows:
The vector from the fromNode ![]() to the toNode
to the toNode ![]() is
is
![\begin{displaymath}
\vec r_{st}
= \left[\begin{array}{c} x_{st} \\ y_{st} \\ \e...
...
- \left[\begin{array}{c} x_{s} \\ y_{s} \\ \end{array}\right]
\end{displaymath}](img55.png)
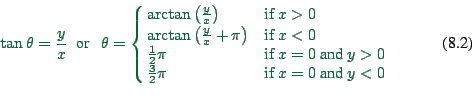
When ![]() is the angle between the x axis and
is the angle between the x axis and ![]() , then
one has
, then
one has
A vehicle's distance on the link from the fromNode is given by
the position of it's cell; if the cell number is ![]() , then the
position is
, then the
position is ![]() , where
, where ![]() is the length of a cell
(typically 7.5 meters).
is the length of a cell
(typically 7.5 meters).
The coordinates of the vehicle now essentially are
After this calculation, vehicles are on the direct line between
two nodes. What is missing is the offset depending on the lane the
vehicle is in. This is just
![\begin{displaymath}
\left[\begin{array}{c}+ w \, \sin \theta \\ - w \, \cos \theta \\
\end{array}\right] \ ,
\end{displaymath}](img62.png)
Corresponding code is
/home/nagel/src/book/sim/book/Link::writeVehFile
For Transims, the header line is significant. For other systems, it may be omitted.
Note the two empty lines between time steps. The empty lines are important for the gnuplot visualization explained below; they are not important for the Transims visualizer and probably not for many other visualizers.
The above is called via
{}
void simulate (...) {
    ...
    for (Links::iterator ll = links.begin(); ll != links.end(); ll++ ) {
        Link* link = ll->second;
        link->writeVehFile(simTime) ;
    }
    ...
}
![\begin{displaymath}
\left[\begin{array}{c}x\\ y\\ \end{array}\right]
= \left[\be...
...}{c}d \, \cos \theta \\ d \, \sin \theta
\\ \end{array}\right]
\end{displaymath}](img61.png)