The size data in the 1992 U.S. economic census comes in
non-equidistant bins. For example, we obtain the number of
establishments with annual sales above 25000 k$, between
10000 k$ and 25000 k$, etc. For an accumulated function, such
as Fig. 5 (right), this is straightforward to use. For
distributions, such as Fig. 5 (left), this needs to be
normalized. We have done this in the following way:
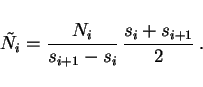
(1) We first divide by the weight of each bin, which is its width.
In the above example, we would divide by
![]() . Note that this
immediately implies that we cannot use the data for the largest
companies since we do not know where that bin ends.
(2) For the log-normal distribution
. Note that this
immediately implies that we cannot use the data for the largest
companies since we do not know where that bin ends.
(2) For the log-normal distribution
![\begin{displaymath}
\rho(x)
\propto {1 \over x} \, \exp\big[ - ( \ln(x) - \ln(\mu) )^2 \big]
\end{displaymath}](img133.png)
For the largest firms (but not for the large establishments), the
census also gives the combined sales of the four (eight, twenty,
fifty) largest firms. We used the combined sales of the four largest
firms divided by four as a (bad) proxy for the sales of each of these
four companies. We then substracted the sales of the four largest
firms from the sales of the eight largest firms, divided again, etc.
Those data points should thus be seen as an indication only, and it
probably explains the ``kink'' near ![]() in
Fig. 5.
in
Fig. 5.