As mentioned in the introduction, we will start with spatial models without price. We will add price dynamics later.
We use a 2-dimensional
![]() grid with periodic boundary
conditions. Sites are numbered
grid with periodic boundary
conditions. Sites are numbered ![]() . Each site belongs to a
cluster, denoted by
. Each site belongs to a
cluster, denoted by ![]() . Initially, each site belongs to
``itself'', that is,
. Initially, each site belongs to
``itself'', that is, ![]() , and thus cluster numbers also go from
, and thus cluster numbers also go from
![]() to
to ![]() .
.
The dynamics is such that in each time step we randomly pick a
cluster, delete it, and the corresponding sites are taken over by
neighboring clusters. Since the details, in particular with respect
to the time scaling, make a difference, we give a more technical
version of the model. In each time step, we first select a cluster
for deletion by randomly picking a number ![]() between
between ![]() and
and ![]() .
All sites belonging to the cluster (i.e.
.
All sites belonging to the cluster (i.e. ![]() ) are marked as
``dead''. We then let adjoining clusters grow into the ``dead'' area.
Because of the interpretation later in the paper, in our model the
``dead'' sites play the active role. In parallel, they all pick
randomly one of their four nearest neighbors. If that neighbor is not
dead (i.e. belongs to a cluster), then the previously dead site will
join that cluster. This step is repeated over and over, until no dead
sites are left. Only then, time is advanced and the next cluster is
selected for deletion.
) are marked as
``dead''. We then let adjoining clusters grow into the ``dead'' area.
Because of the interpretation later in the paper, in our model the
``dead'' sites play the active role. In parallel, they all pick
randomly one of their four nearest neighbors. If that neighbor is not
dead (i.e. belongs to a cluster), then the previously dead site will
join that cluster. This step is repeated over and over, until no dead
sites are left. Only then, time is advanced and the next cluster is
selected for deletion.
In physics this is called a domain coarsening scheme (e.g. [11]): Clusters are selected and deleted, and their area is taken over by the neighbors. This happens with a total separation of time scales, that is, we do not pick another cluster for deletion before the distribution of the last deleted cluster has finished. Fig. 1 shows an example. We will call a cluster of size larger than zero ``active''.
|
[width=0.4]basic-1-gz.eps
[height=0.4]basic-2-gz.eps
|
Note that it is possible to pick a cluster that has already been deleted. In that case, nothing happens except that the clock advances by one. This implies that there are two reasonable definitions of time:
At any particular time step, there is a typical cluster size. In
fact, in cluster time, since there are
![]() clusters, the average cluster size as a
function of cluster time is
clusters, the average cluster size as a
function of cluster time is
![]() .
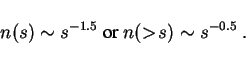
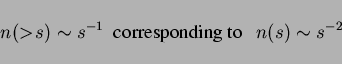
However, if one averages over all time steps, we find a scaling
law. In cluster time, it is numerically close to
.
However, if one averages over all time steps, we find a scaling
law. In cluster time, it is numerically close to
![]() where
where ![]() is the cluster size,
is the cluster size, ![]() is the number of clusters of
size
is the number of clusters of
size ![]() , and
, and ![]() is the number of clusters with size larger than
is the number of clusters with size larger than
![]() .
.![[*]](footnote.png) In natural time, the large clusters have more weight since time
moves more slowly near the end of the coarsening process. The result
is again a scaling law (Fig. 2 (left)), but with
exponents increased by one:
In natural time, the large clusters have more weight since time
moves more slowly near the end of the coarsening process. The result
is again a scaling law (Fig. 2 (left)), but with
exponents increased by one:
![\includegraphics[width=0.49\hsize]{basic-scaling-gpl.eps}](img40.png)
![\includegraphics[width=0.49\hsize]{rnd-inj-gpl.eps}](img41.png)
|
In view of evolution, for example in economics or in biology, it is
realistic to inject new small clusters. A possibility is to inject
them at random positions. So in each time step, before the cluster
deletion described above, in addition with probability ![]() we pick one random site
we pick one random site ![]() and inject a cluster of size one at
and inject a cluster of size one at ![]() .
That is, we set
.
That is, we set ![]() to
to ![]() . This is followed by the usual cluster
deletion. It will be explained in more detail below what this means
in terms of system-wide injection and deletion rates.
. This is followed by the usual cluster
deletion. It will be explained in more detail below what this means
in terms of system-wide injection and deletion rates.
This algorithm maintains the total separation of time scales between the cluster deletion (slow time scale) and cluster growth (fast time scale). That is, no other cluster will be deleted as long as there are still ``dead'' sites in the system. Note that the definition of time in this section corresponds to natural time.
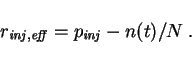
The probability that the injected cluster is really new is reduced by
the probability to select a cluster that is already active. The
probability of selecting an already active cluster is ![]() , where
, where
![]() is again the number of active clusters. In consequence, the
effective injection rate is
is again the number of active clusters. In consequence, the
effective injection rate is
The cluster size distribution for the model of this section is
numerically close to a log-normal distribution, see
Fig. 2 (right). Indeed, the position of the
distribution moves with ![]() (not shown). In contrast to
Sec. 3.1, this is now a steady state result.
(not shown). In contrast to
Sec. 3.1, this is now a steady state result.
It is maybe intuitively clear that the injection mechanism of the
model described in Sec. 3.2 destroys the scaling law from
the basic model without injection (Sec. 3.1), since
injection at random positions introduces a typical spatial scale. One
injection process that actually generates steady-state scaling is
injection along a 1-d line. Instead of the random injection of
Sec. 3.2, we now permanently set

In this case, we numerically find a stationary cluster size
distribution (Fig. 3 (right)) with
|
[width=0.4]snap-line-gz.eps
[width=0.55]line-scaling-gpl.eps
|
One could ask what would happen without space. A possible translation
of our model into ``no space'' is: Do in parallel: Instead of picking
one of your four nearest neighbors, you pick an arbitrary other agent
(random neighbor approximation). If that agent is not dead, copy its
cluster number. Do this over and over again in parallel, until all
agents are part of a cluster again. A cluster is now no longer a
spatially connected structure, but just a set of agents. In that
case, we obtain again power laws for the size distribution, but this
time with slopes that depend on the injection rate ![]() (Fig. 4); see Sec. 4.4 for
details.
(Fig. 4); see Sec. 4.4 for
details.
|
[width=0.49]nsptl-p10-gpl.eps
[width=0.49]nsptl-p01-gpl.eps
|
Fig. 5 shows actual retail company size distributions
from the 1992 U.S. economic census [12], using
annual sales as a proxy for company size. We use the retail sector
because we think that it is closest to our modelling assumptions --
this is discussed at the end of Sec. 6. We show
two curves: establishment size,
and firm size. It is clear that in order to be comparable with our model
assumptions, we need to look at establishment size rather than at
company size.
Census data comes in unequally spaced bins; the procedure to convert it into useable data is described in the appendix. Also, the last four data points for firm size (not for the establishment size, however) were obtained via a different method than the other data points; for details, again see the appendix.
From both plots, one can see that there is a typical establishment size around $400000 annual sales; and the typical firm size is a similar number. This number intuitively makes sense: With, say, income of 10% of sales, smaller establishments will not provide a reasonable income.
One can also see from the plots that the region around that typical
size can be fitted by a log-normal. We also see, however, that for
larger numbers of annual sales, such a fit is impossible since the
tail is much fatter. A scaling law with
This is, however, at odds with investigations in the literature. For
example, Ref. [13] find a log-normal, and
by using a Zipf plot they show that for large companies the tail is
less fat than a log-normal. However, there is a huge
difference between our and their data: They only use publicely
traded companies, while our data refers to all companies in the
census. Indeed, one finds that their plot has its maximum at annual
sales of ![]() , which is already in the tail of our distribution.
This implies that the small scale part of their distribution comes
from the fact that small companies are typically not publicely traded.
In consequence, it reflects the dynamics of companies entering and
exiting from the stock market, not entry and exit of the company
itself.
, which is already in the tail of our distribution.
This implies that the small scale part of their distribution comes
from the fact that small companies are typically not publicely traded.
In consequence, it reflects the dynamics of companies entering and
exiting from the stock market, not entry and exit of the company
itself.
We conclude that from available data, company size distributions are
between a log-normal and a power law with
![]() or
or
![]() . Further investigation of this goes beyond the scope of
this paper.
. Further investigation of this goes beyond the scope of
this paper.
|
[width=0.49]sales-loglog-gpl.eps
[width=0.49]sales-accum-gpl.eps
|
