We have cast our results in terms of the real time ratio, since this is the most important quantity when one wants to get a practical study done. In this section, we will translate our results into numbers of speed-up, efficiency which allow easier comparison for computing people.
Speedup achieved by a parallel algorithm is defined as the ratio of the time required by the best sequential algorithm to solve a problem, T(1), to the time required by parallel algorithm using p processors to solve the same problem,T(p). For simplicity, T(1) is calculated by running the parallel program on one processor.
We can define the Speedup as in the following formula
Speedup is limited by a couple of factors. First, the software overhead appears in the parallel implementation since code length of a parallel implementation is more than the one of sequential program. Second, speedup is generally limited by the speed of the slowest node or processor. Thus, we need to make sure that each node performs the same amount of work. i.e. the system is load balanced. Third, if the communication and computation cannot be overlapped, then the communication will reduce the speed of the overall application. To avoid this, the parallel program should keep the processors busy as much as possible.
A final limitation of the Speedup is known as Amdahl's Law - Serial Fraction.
This states that the speedup of a parallel algorithm is effectively limited
by the number of operations which must be performed sequentially. Thus, let's
define S as the amount of the time spent by one processor on sequential parts
of the program and P as the amount of the time spent by one processor on parts
of the program that can be parallelized. Then, we can formulate the serial run-time
as T(1) := S + P and the parallel run-time as T(p) := S + P/N. Therefore,
the serial fraction F will be
As an illustration, let us say, we have a program containing 100 operations each of which take 1 time unit. If 80 operations can be done in parallel i.e. P = 80 and 20 operations must be done sequentially i.e. S = 20. then by using 80 processors, the Speedup would be 100 / 21 < 5 i.e. a speedup of only 5 is possible no matter how many processors are available.
Now note again that the real time ratio is
![]() Thus,
in order to obtain the speed-up from the real time ratio, one has to multiply
all real time ratios by
T(1)/(1 sec). On a logarithmic scale, a multiplication
corresponds to a linear shift. In consequence, speed-up curves can be obtained
from our real time ratio curves by shifting the curves up or down so that they
start at one.
Thus,
in order to obtain the speed-up from the real time ratio, one has to multiply
all real time ratios by
T(1)/(1 sec). On a logarithmic scale, a multiplication
corresponds to a linear shift. In consequence, speed-up curves can be obtained
from our real time ratio curves by shifting the curves up or down so that they
start at one.
This also makes it easy to judge if our speed-up is linear or not. For example
in Fig. 7 bottom, the curve which starts at
0.5 for 1 CPU should have an RTR of 2 at 4 CPU, an RTR of 8 at 16 CPUs, etc.
Downward deviations from this mean sub-linear speed-up. Such deviations are
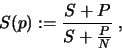
commonly described by another number, called efficiency, and defined as
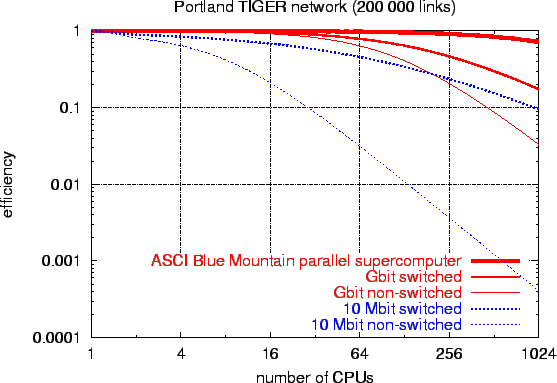
It is obvious that an ideal system with p processors has a speedup equal to p. However, this is not the case in practice since in a parallel program, a processor cannot use 100% of its time for the computation. It should also consume some of its time for the communication. Therefore, we can interpret the efficiency formula above as a measure of the percentage of time for which a processor is utilized effectively. Ideally, efficiency equals to 1 but in practice it is between 0 and 1 depending on how a processor is employed.
Fig. 8 contains curves of the efficiency E as a function of the number of CPUs p for some of the cases discussed above. Note again that these plots contain no new information, they are just re-interpretations of the data used for Fig. 8 bottom. Also note that in our logarithmic plots, E(p) will just be the difference to the diagonal pT(1). Efficiency can point out where improvements would be useful.
|
|