


Next: Other modules
Up: Parallel computing
Previous: Performance prediction for the
Contents
Speed-up and efficiency
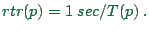
We have cast our results in terms of the real time ratio, since this
is the most important quantity when one wants to get a practical study
done. In this section, we will translate our results into numbers of
speed-up, efficiency, and scale-up, which allow easier comparison for
computing people.
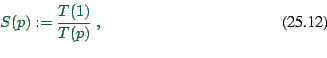
Let us define speed-up as
where  is again the number of CPUs,
  is the time for one
time-step on one CPU, and
is the time for one
time-step on one CPU, and  is the time for one time step on
CPUs. Depending on the viewpoint, for one uses either the
running time of the parallel algorithm on a single CPU, or the fastest
existing sequential algorithm. Since Transims has been designed for
parallel computing and since there is no sequential simulation with
exactly the same properties, will be the running time of the
parallel algorithm on a single CPU. For time-stepped simulations such
as used here, the difference is expected to be small.25.4
is the time for one time step on
CPUs. Depending on the viewpoint, for one uses either the
running time of the parallel algorithm on a single CPU, or the fastest
existing sequential algorithm. Since Transims has been designed for
parallel computing and since there is no sequential simulation with
exactly the same properties, will be the running time of the
parallel algorithm on a single CPU. For time-stepped simulations such
as used here, the difference is expected to be small.25.4
Now note again that the real time ratio is
 Thus, in order to obtain the speed-up from the real time ratio, one
has to multiply all real time ratios by
Thus, in order to obtain the speed-up from the real time ratio, one
has to multiply all real time ratios by  . On a
logarithmic scale, a multiplication corresponds to a linear shift. In
consequence, speed-up curves can be obtained from our real time ratio
curves by shifting the curves up or down so that they start at one.
. On a
logarithmic scale, a multiplication corresponds to a linear shift. In
consequence, speed-up curves can be obtained from our real time ratio
curves by shifting the curves up or down so that they start at one.
This also makes it easy to judge if our speed-up is linear or not.
For example in Fig. 25.12 bottom, the curve which starts
at 0.5 for 1 CPU should have an RTR of 2 at 4 CPU, an RTR of 8 at
16 CPUs, etc. Downward deviations from this mean sub-linear speed-up.
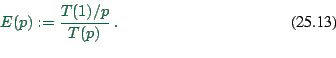
Such deviations are commonly described by another number, called
efficiency, and defined as
Fig. 25.13 contains an example. Note that this number contains
no new information; it is just a re-interpretation. Also note that in
our logarithmic plots,  will just be the difference to the
diagonal
will just be the difference to the
diagonal  . Efficiency can point out where improvements
would be useful.
. Efficiency can point out where improvements
would be useful.
Figure 25.13:
Efficiency for the same configurations as in Fig. 25.12 bottom. Note that the curves contain exactly the same information.
|
|
Next: Other modules
Up: Parallel computing
Previous: Performance prediction for the
Contents
2004-02-02
![\includegraphics[width=0.8\hsize]{eff-gpl.eps}](img323.png)