Next: Yield sign behavior
Up: Traffic flow characteristics
Previous: Rules of the model
Contents
Subsections
In order to control the effect of driving rules, Transims provides
controlled tests for traffic flow behavior. These tests are
simplified situations where elements of the microsimulation can be
tested in isolation. This test suite uses the standard
microsimulation code in the same way it is used for full-scale
regional simulations, and it also uses the same input and output
facilities: The test network is currently defined via a table in an
Oracle data base, in the same format as the Dallas/Fort Worth network
is kept. Input of vehicles is, following individual vehicle's plans,
via parking locations, the same way vehicles enter regional
simulations.32.11 Output is collected on certain parts of the network on a
second-by-second basis, the same way it can be collected for regional
microsimulations. The collected output is then post-processed to
obtain the aggregated results presented in this paper.
The test cases we look at in this paper are the following (see also
Fig. 32.1 (e)):
- One-lane traffic, in order to see if car following behavior generates
reasonable fundamental diagrams.
- Three-lane traffic, in order to see if the addition of passing lane changing
behavior still generates reasonable fundamental diagrams, and in order
to look at lane usage.
- Stop sign, yield sign, and left turns against oncoming traffic, in
order to see it the logic for non-signalized intersections generates
acceptable flow rates.
- A signalized intersection, in order to see of we obtain reasonable
flow rates, and in order to check lane changing behavior for plan
following purposes.
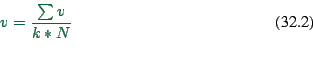
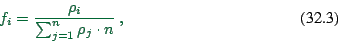
We look at three minute averages of the following
quantities:
Essentially two test networks are used: a circle of 1000 sites  0.75 km in various configurations, and a simple signalized
intersection. Most of the tests are run on the circle networks. The
circle can have one, two, or three lanes. In all tests, the circle is
slowly loaded with traffic via a parking location at site
0.75 km in various configurations, and a simple signalized
intersection. Most of the tests are run on the circle networks. The
circle can have one, two, or three lanes. In all tests, the circle is
slowly loaded with traffic via a parking location at site  (where
the unit of
(where
the unit of  is ``cells''). Velocity, flow, and density are
measured on
is ``cells''). Velocity, flow, and density are
measured on
 , thus generating the fundamental
diagrams for one-lane, two-lane, and three-lane traffic. Since the
circle gets slowly loaded, the complete fundamental diagram is
generated during one run.
, thus generating the fundamental
diagrams for one-lane, two-lane, and three-lane traffic. Since the
circle gets slowly loaded, the complete fundamental diagram is
generated during one run.
For testing yield signs and stop signs, an incoming lane is added on
the right side of traffic at  . The characteristics of the
incoming traffic are measured by a detector on the last 5 sites of the
incoming lane. The incoming lane is operated at maximum flow, i.e. with as many vehicles as possible entering. The incoming vehicles are
removed at
. The characteristics of the
incoming traffic are measured by a detector on the last 5 sites of the
incoming lane. The incoming lane is operated at maximum flow, i.e. with as many vehicles as possible entering. The incoming vehicles are
removed at  via a parking accessory. The result of this
measurement is typically a diagram showing the flow of incoming
vehicles on the y-axis versus the flow on the circle on the x-axis.
via a parking accessory. The result of this
measurement is typically a diagram showing the flow of incoming
vehicles on the y-axis versus the flow on the circle on the x-axis.
For testing left turns against oncoming traffic, an opposing lane is
added so that it ends at  . The traffic control here is again
a ``yield'' logic; the difference from before is that vehicles only traverse the opposing traffic, they do not join it.
. The traffic control here is again
a ``yield'' logic; the difference from before is that vehicles only traverse the opposing traffic, they do not join it.
Last, a three-lane intersection approach is used. The left lane makes
a left turn, the middle lane goes straight, the right lane makes a
right turn. Incoming vehicles have plans about their intended
movement at the intersection and attempt to reach the corresponding
lane. The intersection has signals with 1 minute green phase and
1 minute red phase. The typical output from this run is the flow of
vehicles which go through the intersection, and the number of vehicles
which cannot make their intended turn because they did not reach their
lane.
The results are shown in Figs. 32.2
to 32.5.
- Single lane traffic (Fig. 32.2a) has a realistic value of
maximum flow ( capacity), but one may argue that it is at a
somewhat low density. The problem here is that we do not include slow
vehicles; introducing slow vehicles into a single lane closed circle
simulation just means that all fast vehicles bunch up behind them,
which does not result in a very useful fundamental diagram. In terms
of the ``building block'' philosophy, we prefer to run the single lane
test with identical vehicles.
- Our lane changing rules do neither change maximum flow per lane nor
the density (per lane) at maximum flow. That need not be the
case, (102). Again, the density at maximum flow
seems a bit low. This changes considerably when one introduces slower
vehicles: The free flow part of the curve then bends more to the right
and the maximum is at higher densities (90). Also,
there are measurements in Germany where traffic with trucks
reaches maximum flow at approx. 20-22 veh/km/lane (126), so without more
specific data this discussion seems pointless. - We think that the
curve without slow vehicles is ``cleaner'' and thus facilitates
comparison between models; in reality, the problem is more complicated
anyway.
Also, we generate equal lane usage between the lanes, as should be
expected for a symmetric lane changing model (in the absence of
on-ramps).
- The flow through a traffic signal that is 50% green should be at half
the value of the maximum single lane flow, i.e. at 1000 veh/hour,
which is what we find (Fig. 32.4).
- The curves for traffic through stop and yield signs follows the
general form of the curve of the Highway Capacity
Manual (114). We added the HCM curves for comparison only.
In general, we find that a yield sign, when there is no traffic on the
major road, generates the same traffic as if there were no sign at
all, which should be expected the way the simulation is set up. (It
is a bit lower than for the ``circle'' before because the speed limit
is lower here.) The stop sign generates a much lower flow in the same
situation, because the explicit stop decreases capacity.
From there, the curves for ``traffic into'' the major road decrease
roughly linearly to zero when the flow on the major road reaches
capacity. The curve for traffic across a single lane road looks
similar to its ``traffic into'' counterpart, which is to be expected
because the number of opposing lanes is one in both cases. The curve
for traffic across a two lane road provides roughly half the flow of
traffic across a single lane road.
For densities above capacity on the major road, all curves bend ``back
on themselves''. If the major road is congested, the speed there is
zero, and the gap acceptance criterion ``accept if
 '' is always fulfilled, even for
  . Nevertheless,
for ``traffic into'', very little traffic makes it through the yield
or the stop sign. The reason is that in Transims, vehicles on the
major road that may go through the intersection ``reserve'' the first
cell at the beginning of the next link, thus blocking this link for
vehicles from the minor link even if the gap acceptance rule would
allow the movement. For ``traffic across'', this restriction does not
exist, and many vehicles make it through the intersection, probably
many more than is realistic. - Note that the HCM does not provide any
information in the congested regime.
. Nevertheless,
for ``traffic into'', very little traffic makes it through the yield
or the stop sign. The reason is that in Transims, vehicles on the
major road that may go through the intersection ``reserve'' the first
cell at the beginning of the next link, thus blocking this link for
vehicles from the minor link even if the gap acceptance rule would
allow the movement. For ``traffic across'', this restriction does not
exist, and many vehicles make it through the intersection, probably
many more than is realistic. - Note that the HCM does not provide any
information in the congested regime.
Next: Yield sign behavior
Up: Traffic flow characteristics
Previous: Rules of the model
Contents
2004-02-02
![$\displaystyle {\it q\/} = \frac{\it N\/}{\it T} \;\;\;\;\;\; [vehicles/hour]$](img808.png)